
Coffee businesses using the current generation of tools risk making poor decisions
Get the latest Audio Articles by subscribing wherever you get podcasts
Coffee farms both emit greenhouse gases and are impacted by climate change. As the climate warms and extreme weather events become more frequent, farmers are simultaneously reducing their emissions and working to mitigate the impacts of climate change. The difficulties they face are unparalleled. And the challenges become greater as the world further warms.
Coffee farming is the foundation of the coffee industry. Without reliable supply of green coffee, downstream businesses, such as roasters and shops, also face an uncertain future. This existential threat is focusing industry attention. Research and resources are being deployed to understand the causes of emissions and ensure a future for coffee farming. There remains much work to be done, and to build a sustainable future will require significantly more resource.
At the same time, some consumer-facing coffee businesses have recently started calculating their carbon footprint, often in response to coffee drinker interest. The science, industry research and carbon calculators agree that coffee production is a key cause of coffee’s carbon footprint.
Coffee farm greenhouse gas emissions
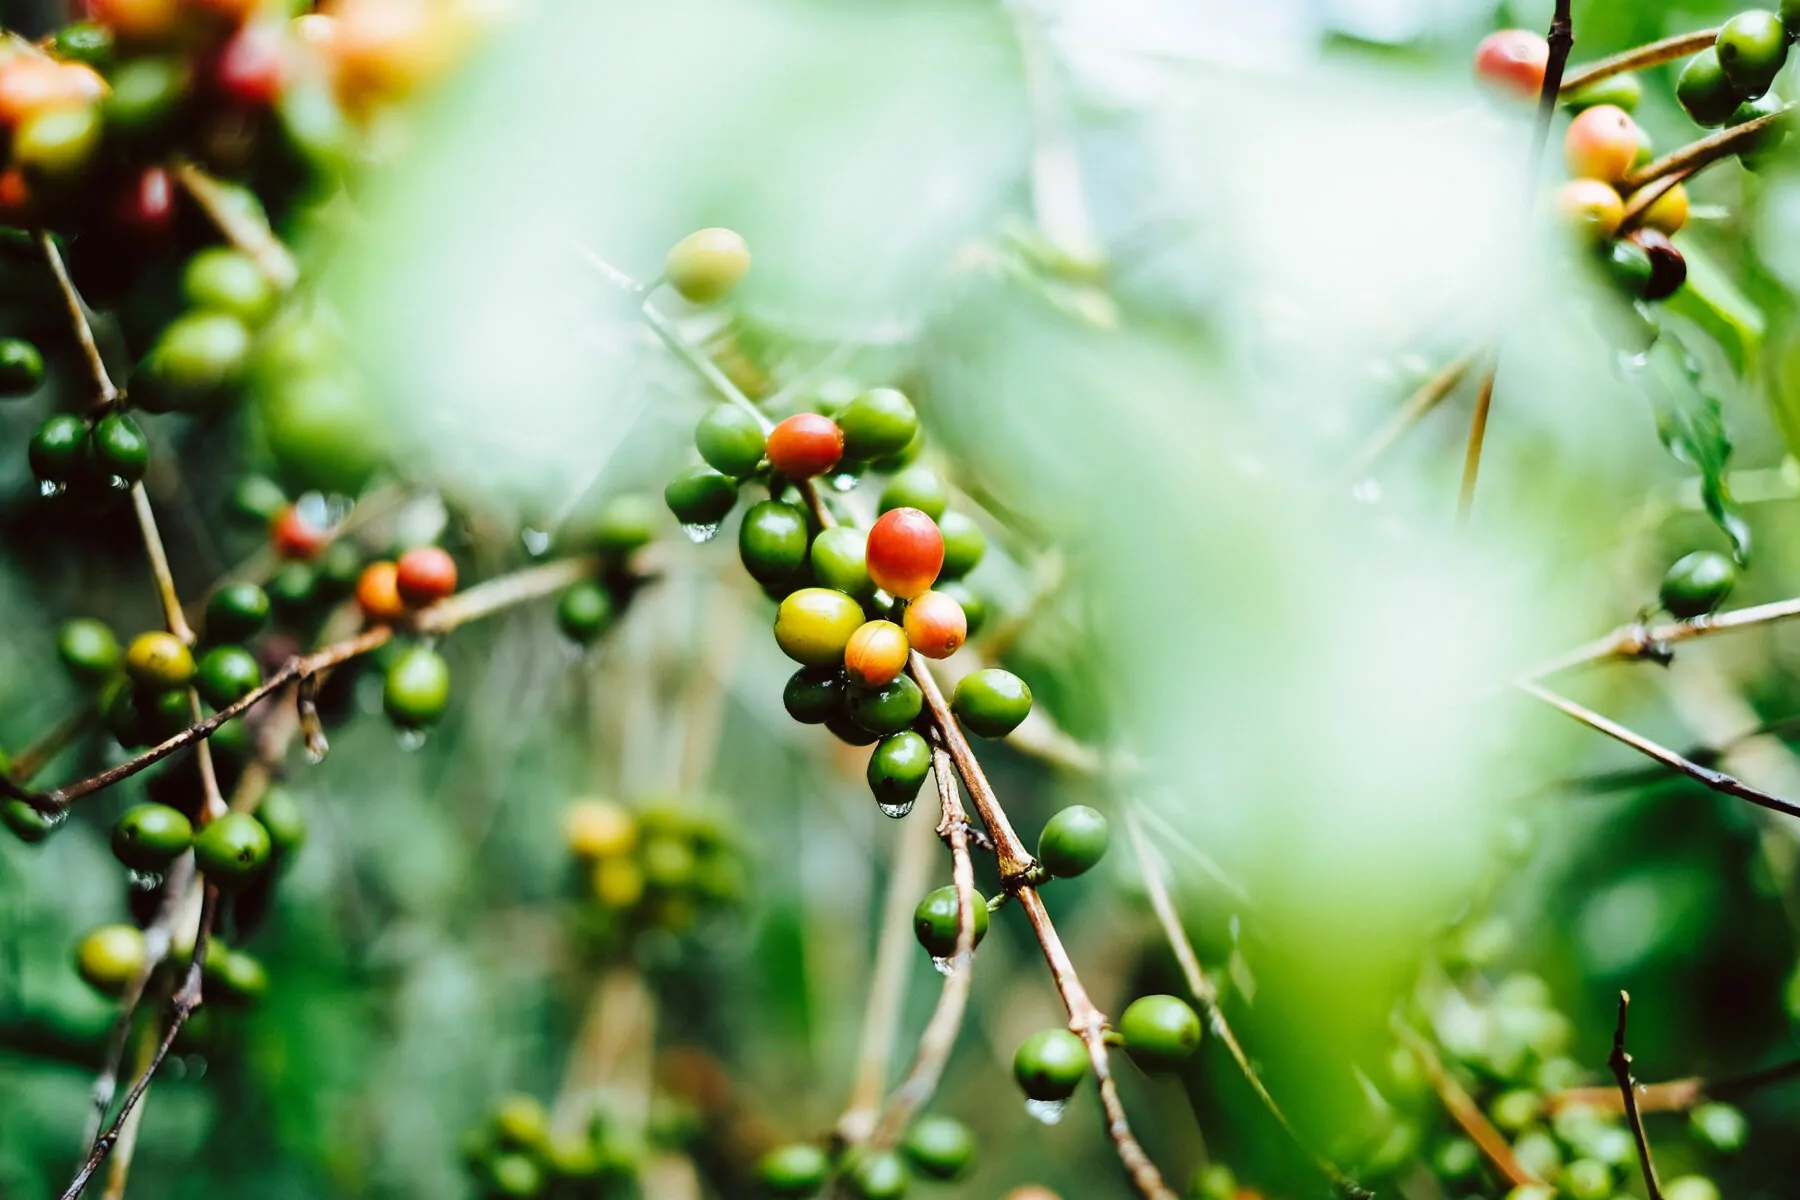
Farm greenhouse gas emissions are generated primarily by the inputs to grow and process coffee. A foundational study examining Brazilian coffee farms found 1,000 Kg of green coffee required 11,400 litres of water, over 90 litres of diesel and 900 Kg of fertiliser.
The carbon footprint of green coffee production varies depending on the specific farming and production methods. Some studies calculate emissions to be as low as 0.5 Kg per kilogram of green coffee at milling. Other researchers estimate the carbon footprint of green coffee to be as high as 12 Kg per kilogram.
With such a large range, how can coffee businesses identify an accurate figure to estimate their carbon footprint? This article explains that there is currently no good way to pick a figure. Plus, the carbon models require updating, so any figure you choose is likely to be wrong. At present the uncertainty is so great that, for most coffee businesses, calculating your green’s carbon footprint is a fool’s errand.
The situation needs to be carefully managed by all coffee companies attempting to calculate their carbon footprint. But businesses closer to origin, such as green brokers and roasters, face even greater challenge. These businesses’ footprints are largely determined by the emissions generated during green coffee production, rather than their own operations. The risk is that an incorrectly chosen figure skews the assessment of what should be done to cut emissions.
Some studies calculate emissions to be as low as 0.5 Kg per kilogram of green coffee at milling. Other researchers estimate the carbon footprint of green coffee to be as high as 12 Kg per kilogram.
The varying estimates of green’s carbon footprint are understandable
With over 10 million hectares of land under production, across almost 60 countries, producing over 130 million bags of green, coffee farming practices are hugely diverse. There are also a range of coffee varietals and a growing number of process methods. It is the variety and complexity of production that gives coffee its unique range of flavours. Any expectation of a simple figure encompassing all variables is misplaced.
Scientists and industry bodies are working to better understand how each production variable contributes to climate change. Until we have this data, it is too early to accurately calculate green’s coffee carbon footprint.
This article uses insights from already-published, leading academic and industry studies to understand the key causes of green coffee’s carbon footprint – and to identify the limits of our current knowledge.
Categorising coffee farms
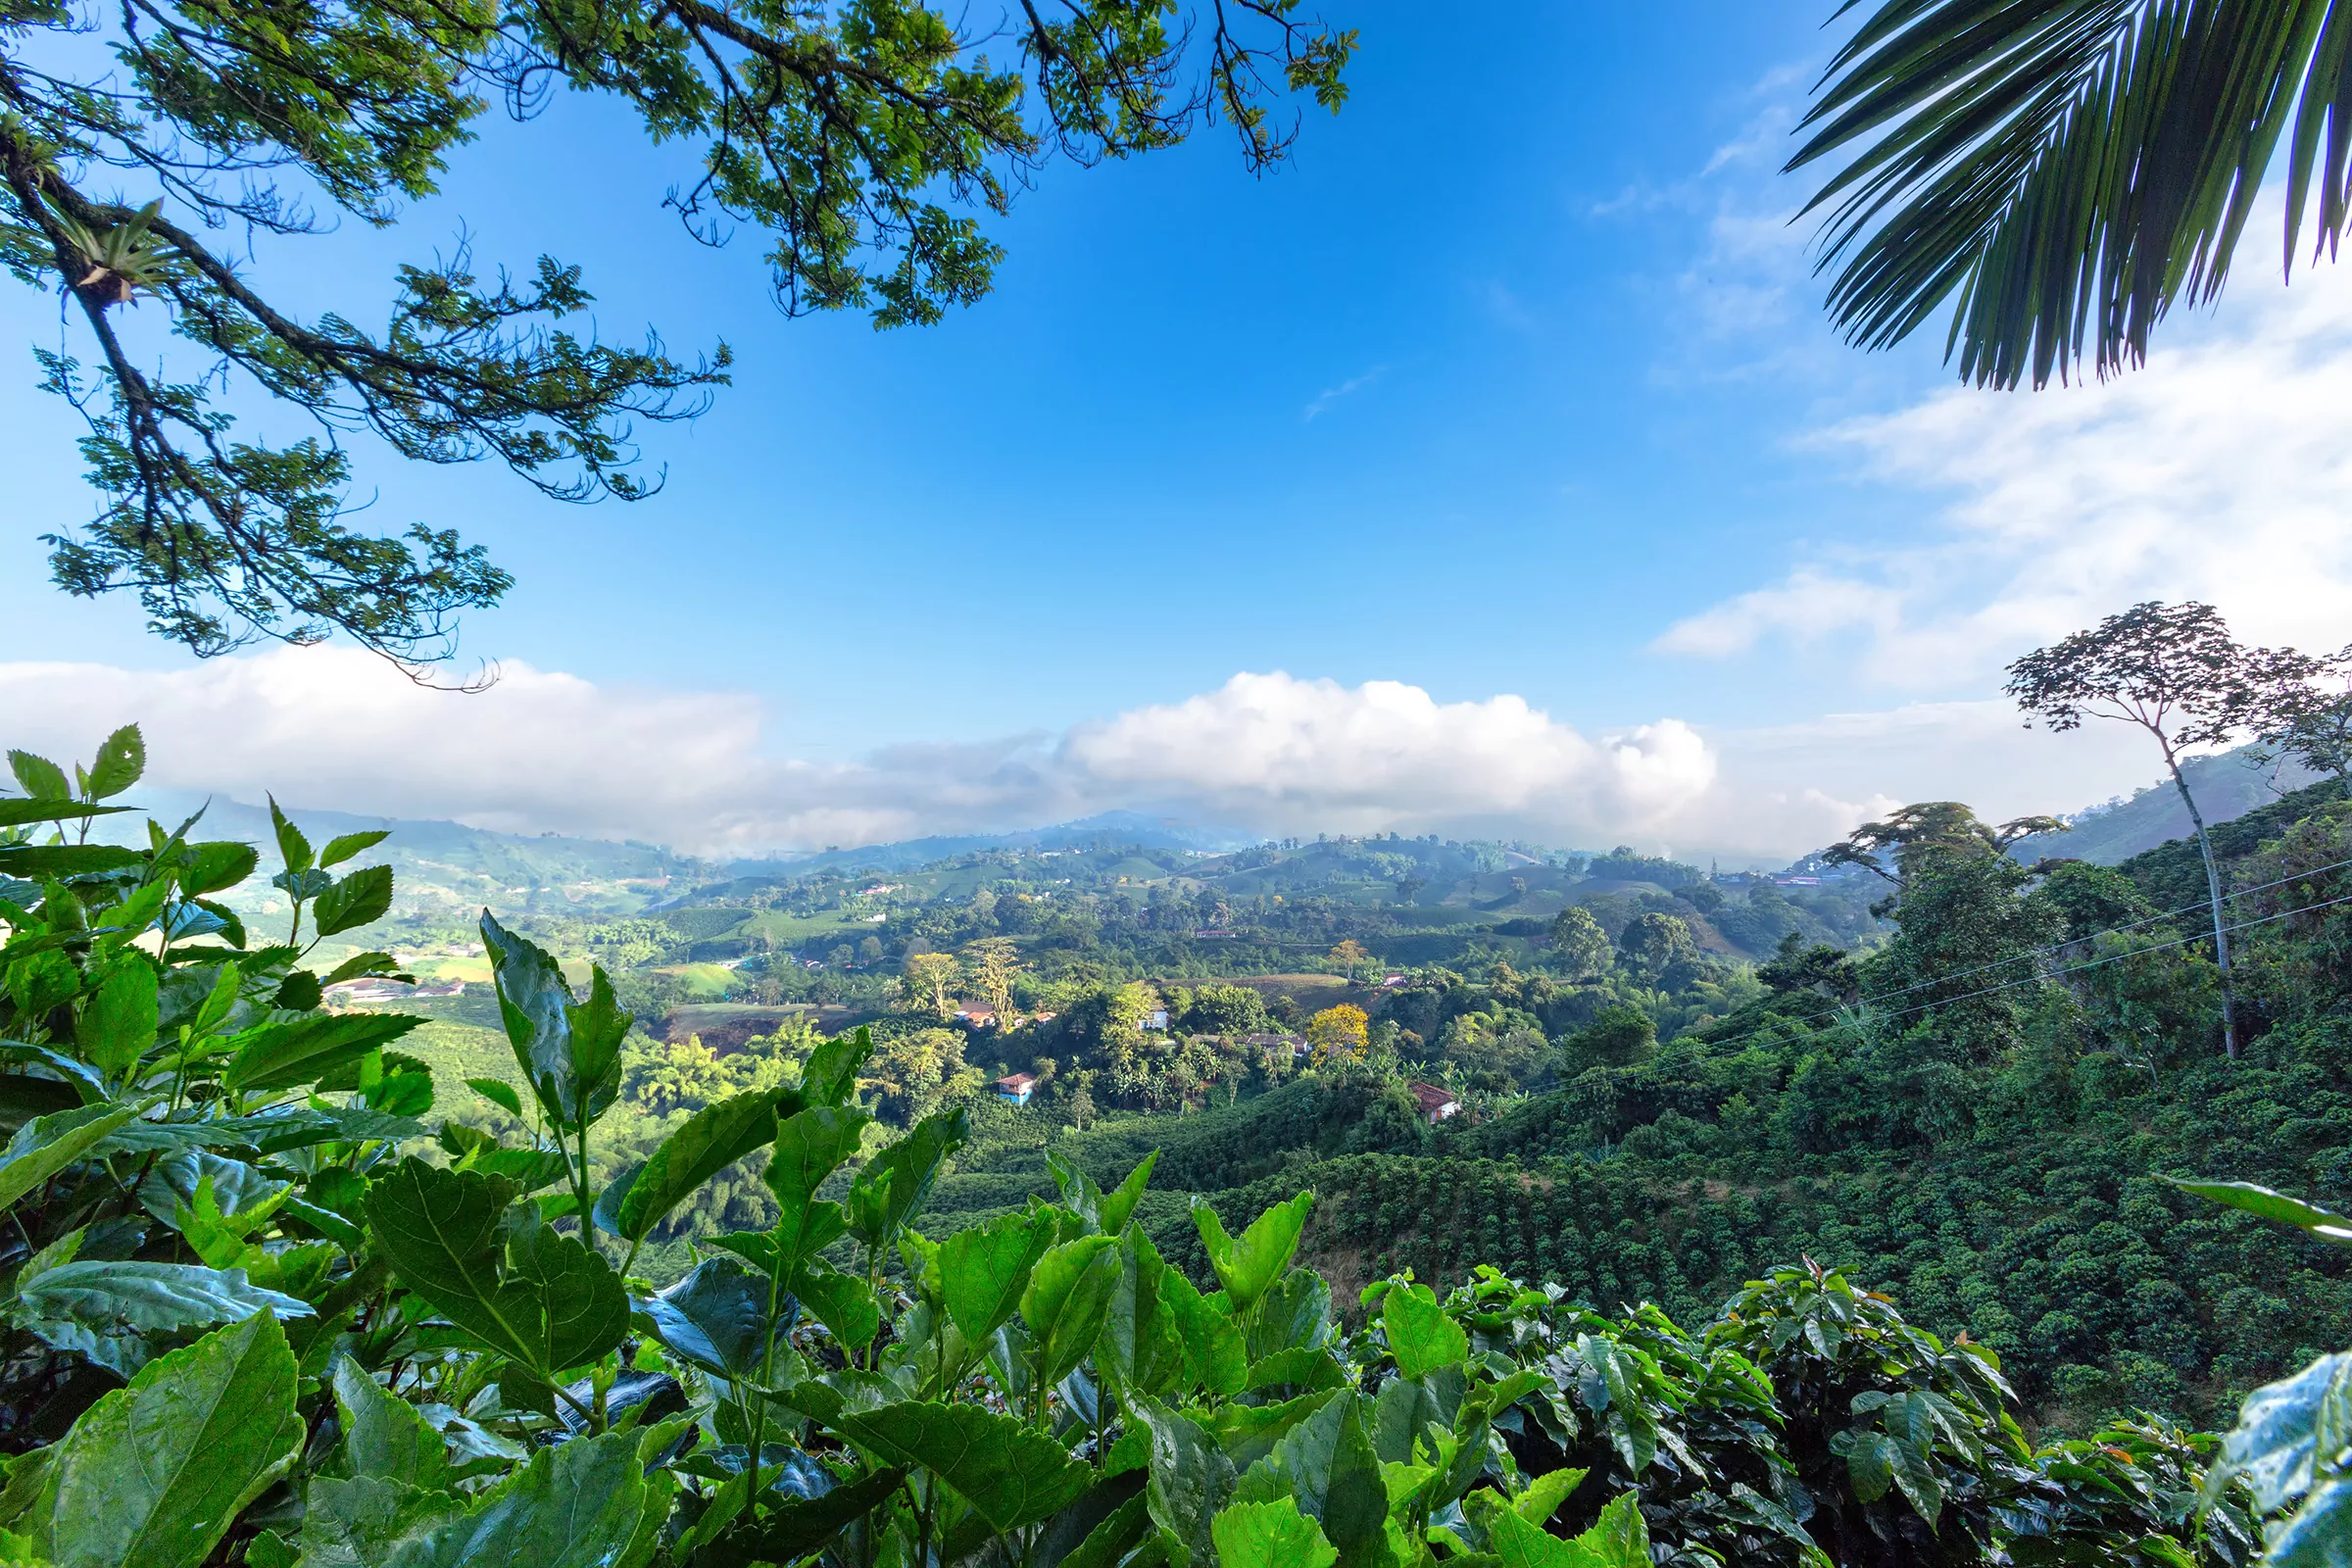
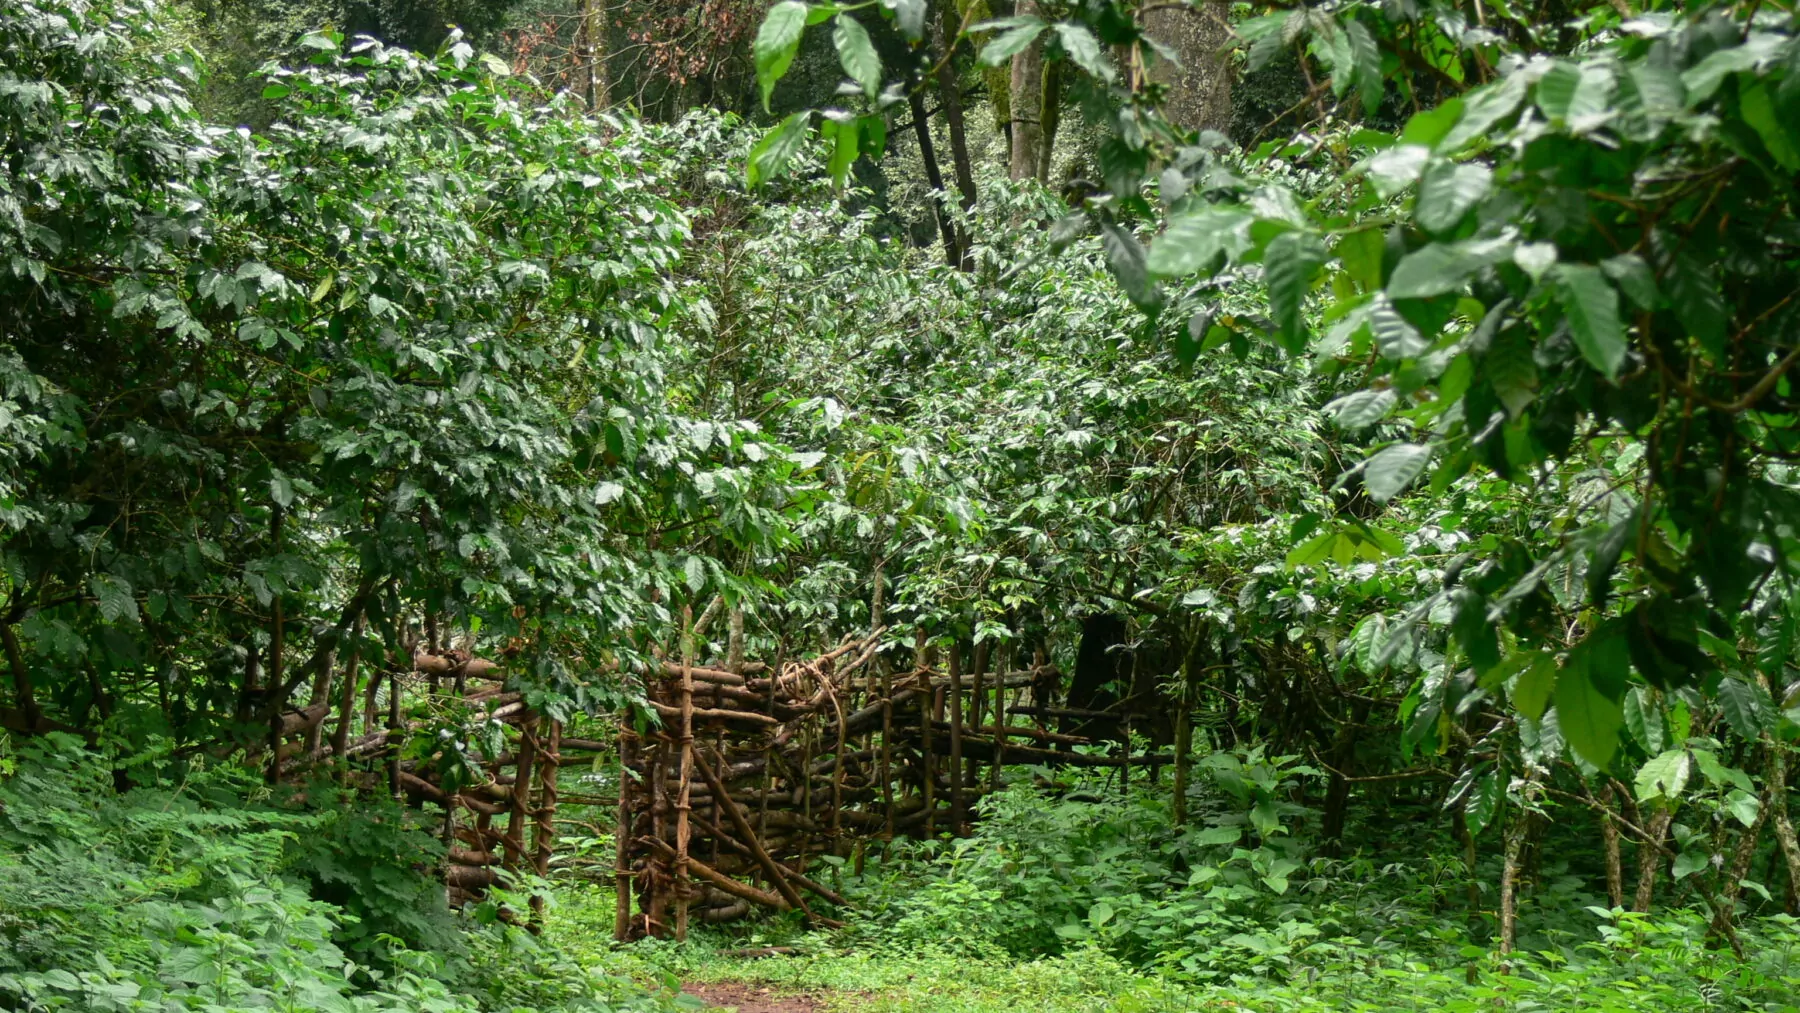
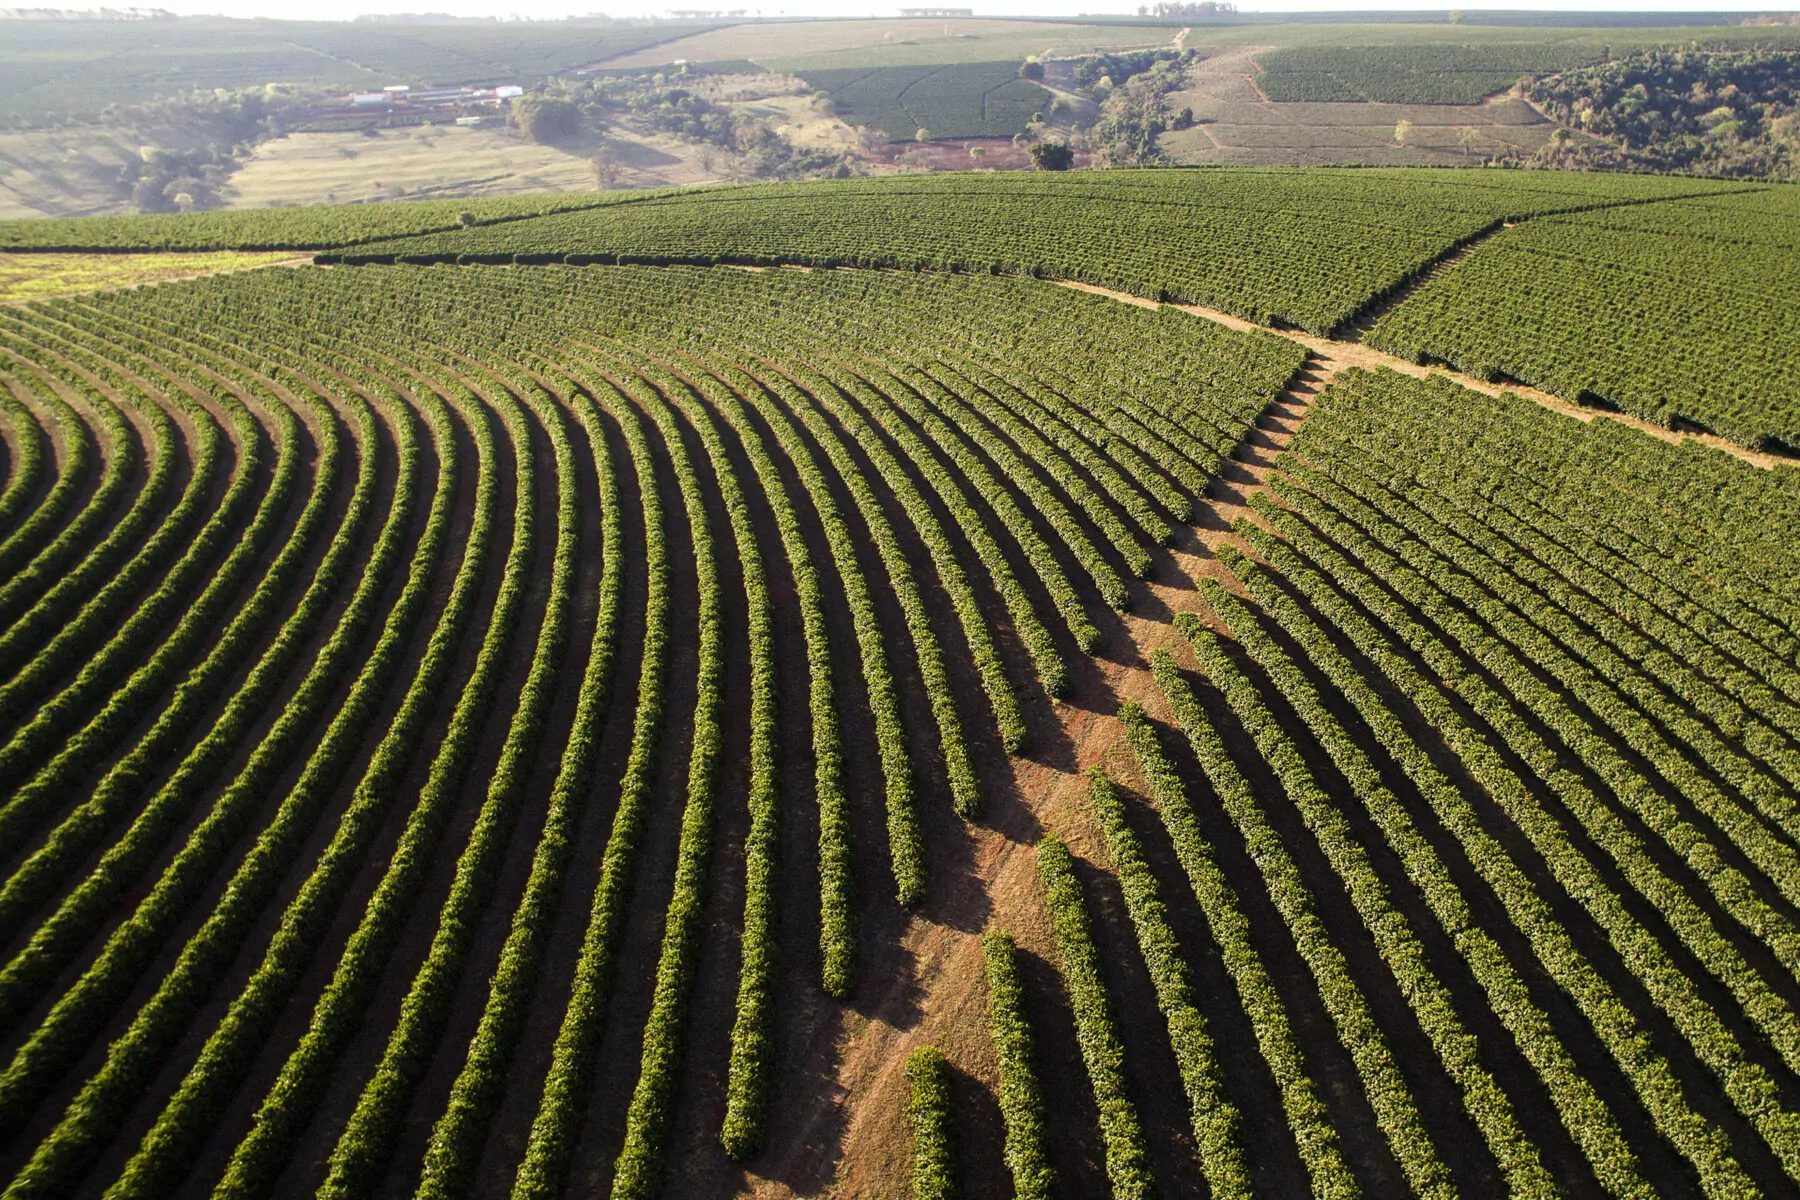
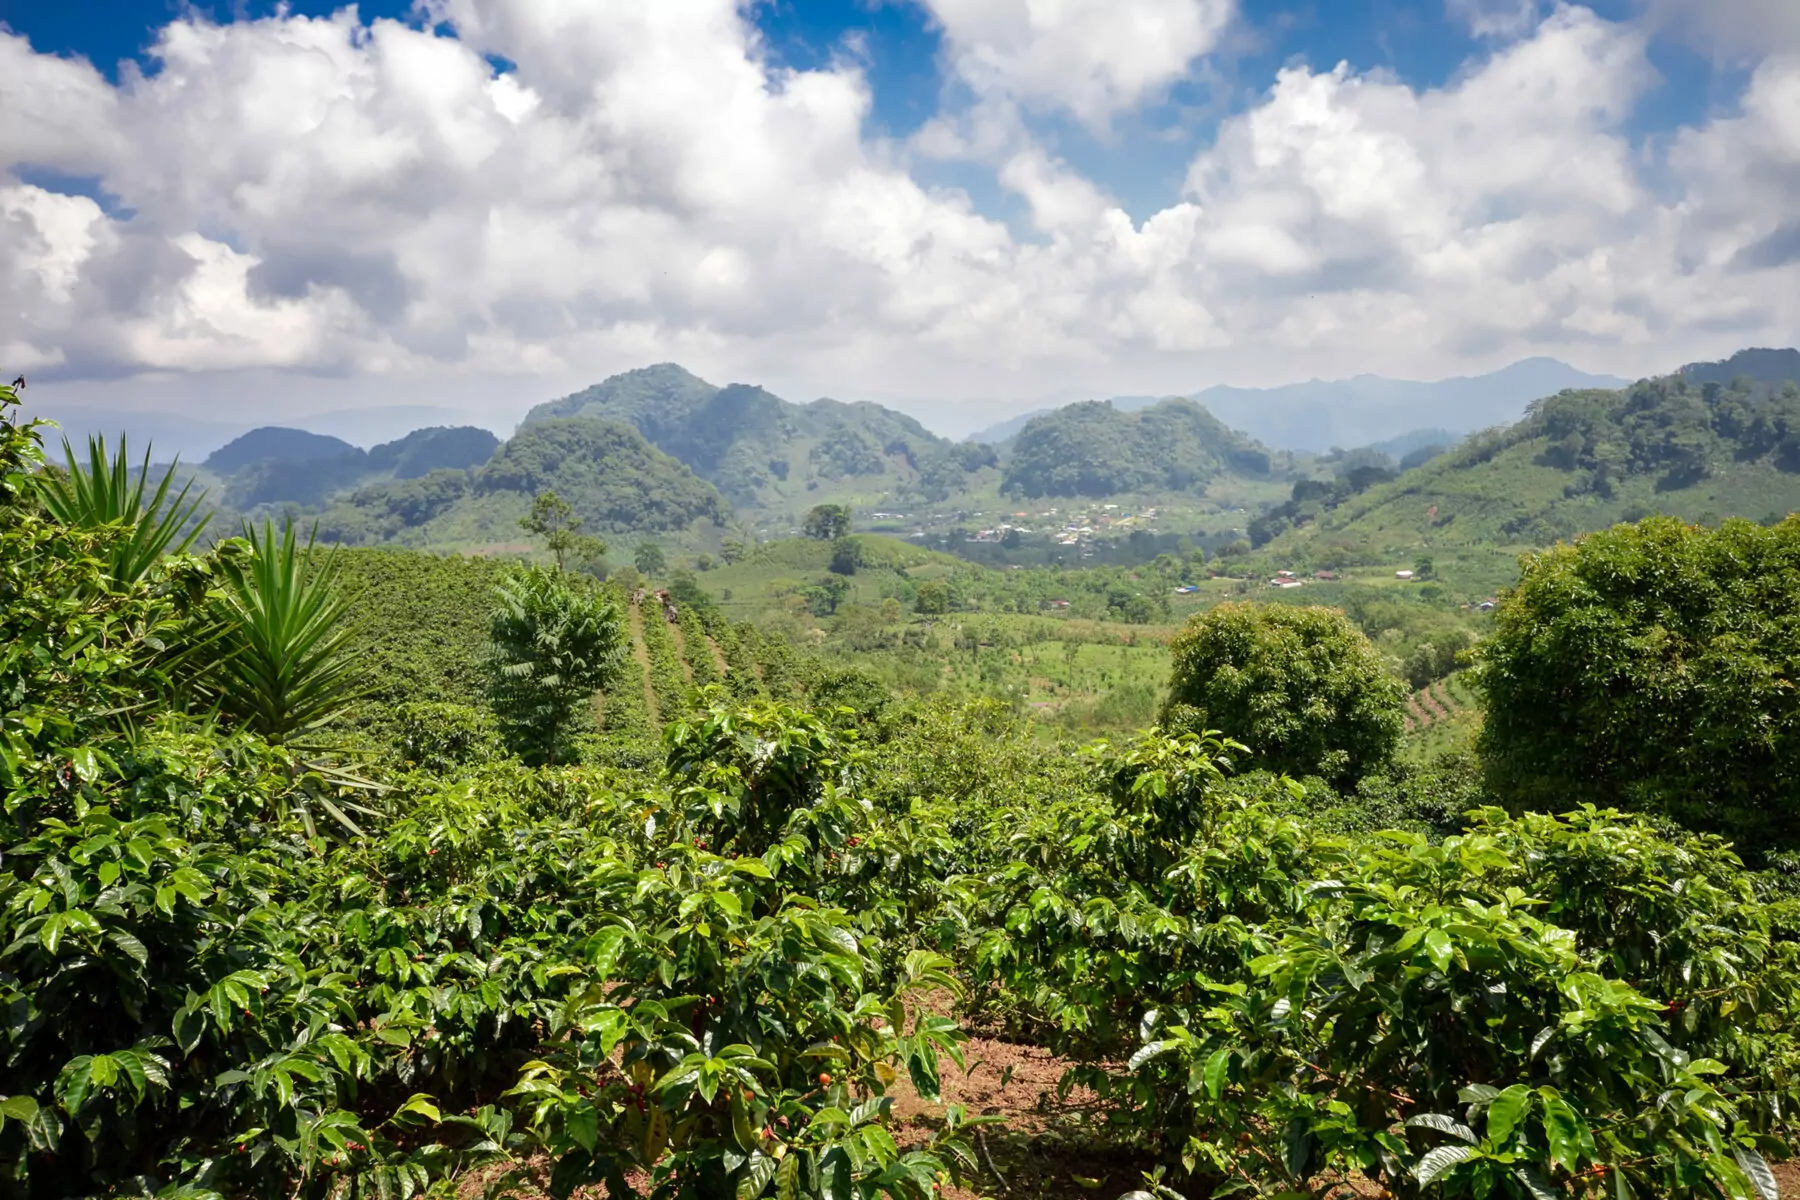
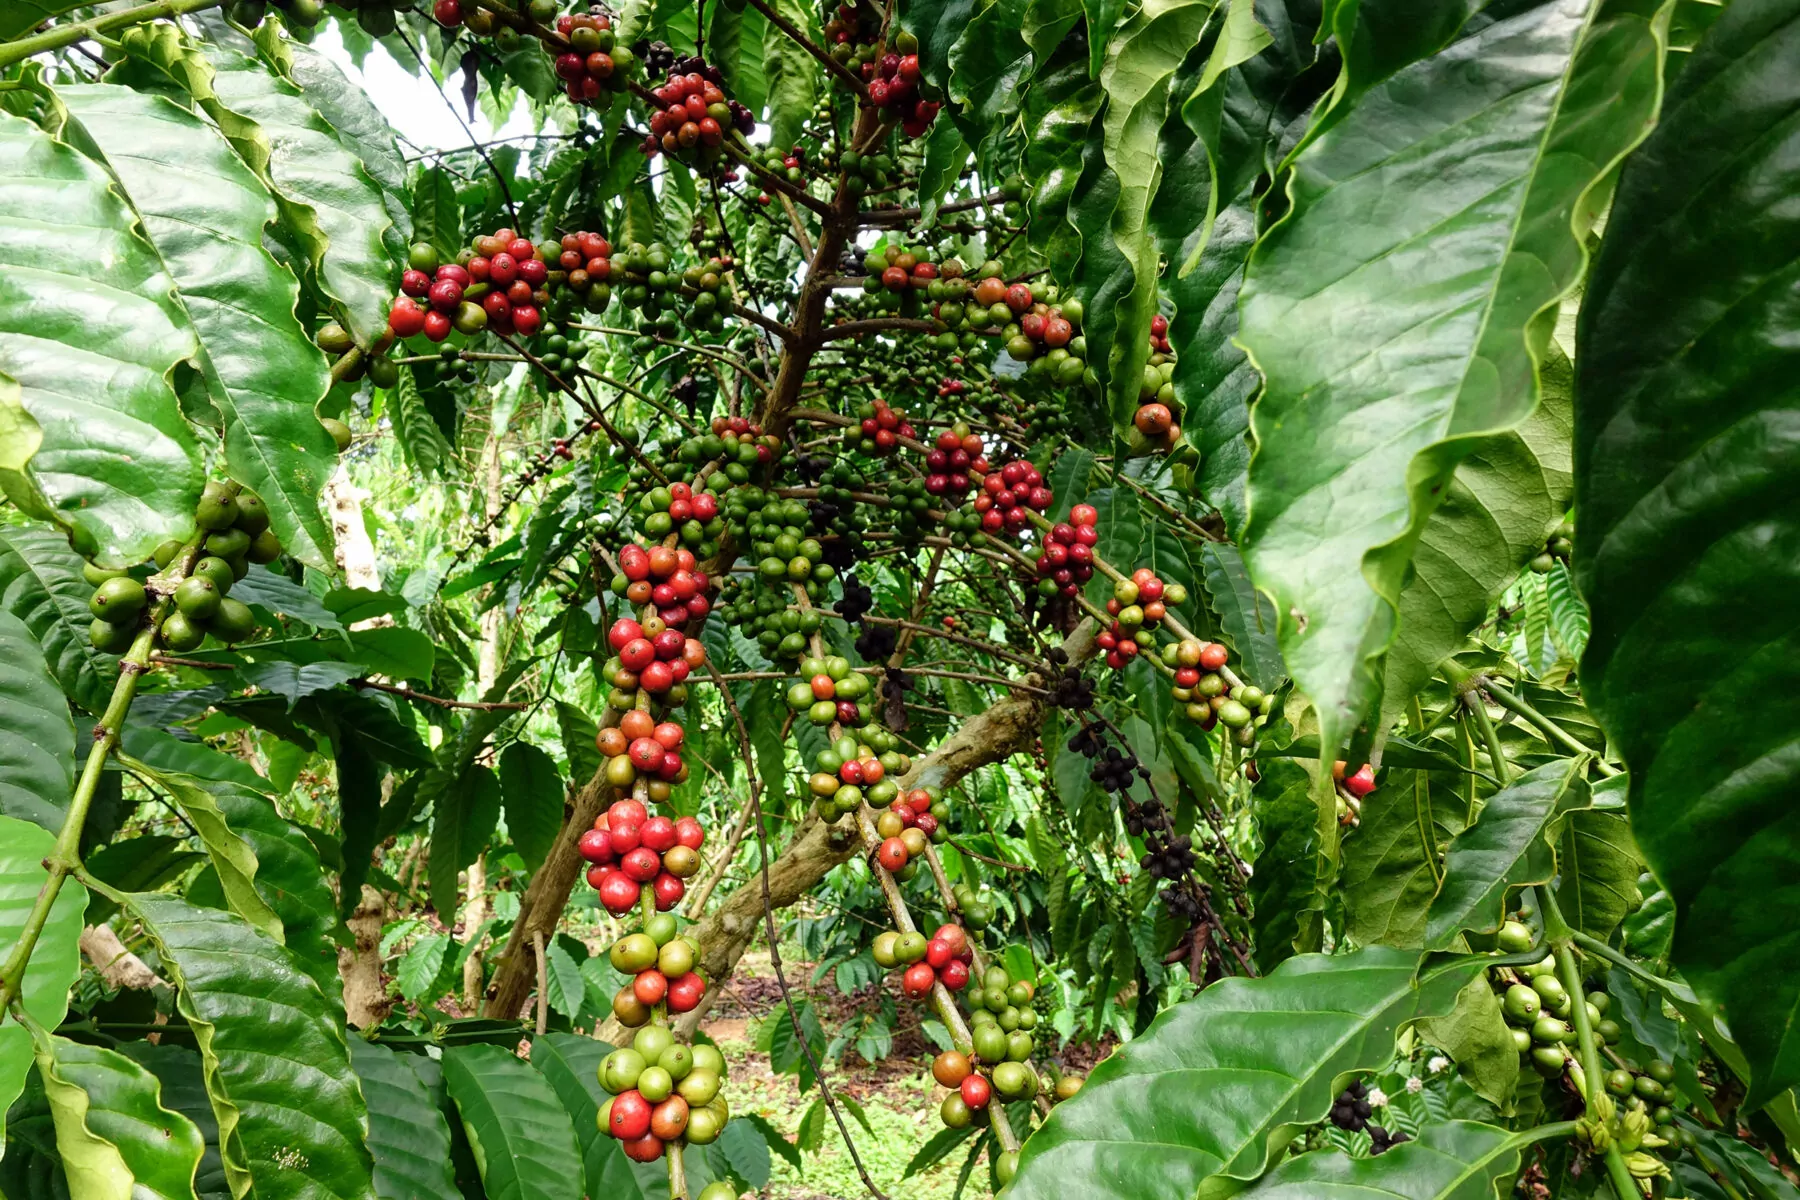
Coffee is farmed in a range of ways. In the wild, coffee naturally grows as a shrub under tree canopy as part of a larger forest ecosystem. This model of production persists in some parts of central Africa, where cherries are sold by foragers to mills for processing. At the other extreme, mechanised production of coffee plantations is typical in Brazil, where coffee farming is a complex agribusiness.
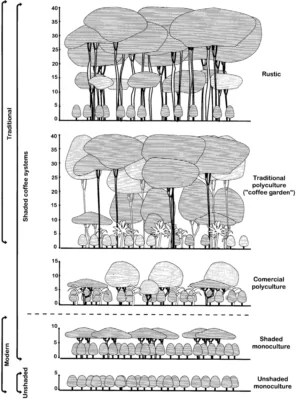
Between these extremes is a range of farm types, including traditional polyculture, commercial polyculture and shaded monoculture. Each of these farm types has different carbon emissions as well as a different capacity to absorb and store carbon.
Carbon dioxide is necessary for plant growth
Plants have the opposite breathing cycle to humans. Absorbing carbon dioxide from the air, plants grow by converting CO2 into carbon and exhaling the oxygen. Plant carbon sequestration lowers atmospheric carbon dioxide levels and is an essential tool for combating climate change. A study examining Costa Rican coffee farms estimates that coffee grown amongst diverse forest has the capacity to absorb up to 116 tonnes of carbon dioxide per hectare. By comparison, shaded monoculture can store just 40 tonnes.
To calculate green coffee’s carbon footprint, the basic measure should be the emissions from coffee production minus the carbon sequestered by plants on the farm. However, even this foundational rationale faces methodological challenges and is often not adequately incorporated into current carbon footprint models.
Before examining these models, it’s useful to note that forest has multiple benefits. Areas of land that have diverse, well-established vegetation are more resilient to pests and extreme weather events, can cool the air by two degrees and help prevent soil erosion. Coffee grown in a forest setting also typically requires less fertiliser. These are attributes that are essential either for cutting carbon emissions or mitigating the impacts of climate change.
There is a significant opportunity for more coffee to be grown in polycultural farm systems. Currently 25% of coffee production is under diverse shade, about 35% under partial shade and 40% is under full sun.
As a rule of thumb, coffee grown as part of a polyculture coffee farm system benefits from lower emissions, is more resilient and supports biodiversity.
Understanding carbon emissions from various farm systems
Examining over 100 farms across Central America, researchers found commercial polyculture farms typically have the lowest carbon footprint. The same study found shaded monoculture to be, on average, the most carbon intensive. However, within each farm type there was huge variation caused by other factors, especially fertiliser use and processing method.
It’s too simplistic to say that polyculture is the only sustainable farming system or even that it has the lowest carbon emissions. The study also identified farms in each category that produced cherries with a footprint less than half the average. In other words, farm practices are equally important to reducing carbon emissions as the farm’s planting system.
For example, while monocultural coffee production systems are highly dependent on the carbon-intensive inputs of fertiliser, diesel and water, they can achieve twice the yield per hectare of traditional polyculture farms. It’s possible for high yielding monoculture with moderate fertiliser application to produce green coffee with a lower carbon footprint per kilogram of green than typical polycultural coffee production.
About 35% of green coffee’s emissions are from fertiliser application. The emissions are generated from both its commercial production as well as run off and nitrogen gas emissions following application. The importance of fertiliser is further underscored when focusing on emissions during cherry production. A widely-cited paper analysing coffee farms in Costa Rica identified emissions from fertiliser application to be as high as 94% of a cherry’s carbon footprint.
There’s a possibility that fertiliser use can be reduced on some farms without harming yield. For example there was a low correlation between the quantity of fertiliser used in the farms and the yield per hectare in a key study of Brazilian coffee production.
Recognising that farmers are incentivised to over-apply fertiliser to protect against poor yield, research is underway so that improved application guidance can be provided. As well as cutting carbon emissions, reduced fertiliser use cuts farmers’ production costs increasing profitability.
Some farms use organic fertilisers, made from manure and compost, for historic, financial or philosophical reasons. Organic fertiliser has a lower carbon footprint than manufactured fertiliser.
A study examining farms in Costa Rica and Nicaragua found that organic farms have a carbon footprint of 120 to 520 grams per kilogram of cherries, compared with farms using manufactured fertiliser where the footprint was 260 to 670 grams per kilogram.
Again as a rule of thumb, farms using organic fertiliser have a lower carbon footprint. However, organic production comes with its own complexities and is not a universal solution.
About 35% of green coffee’s emissions are from fertiliser.
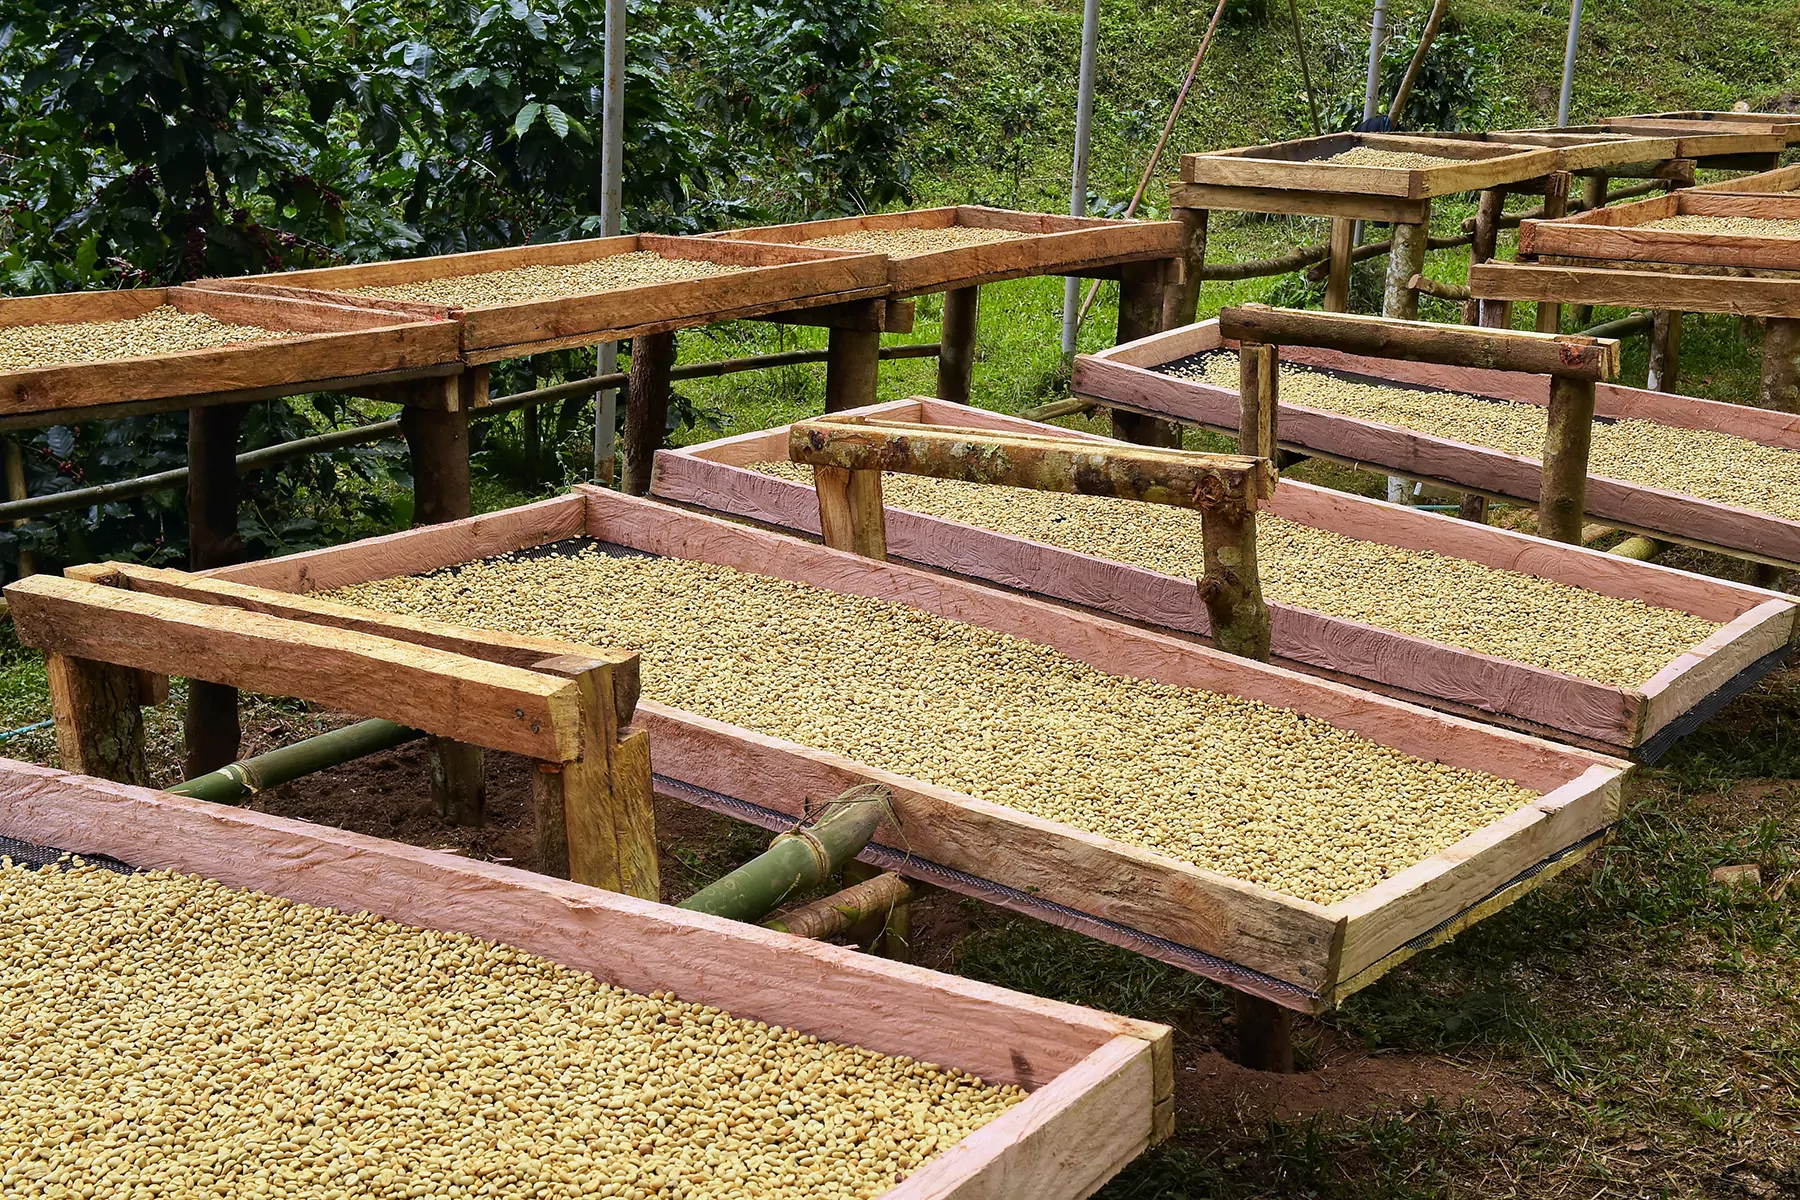
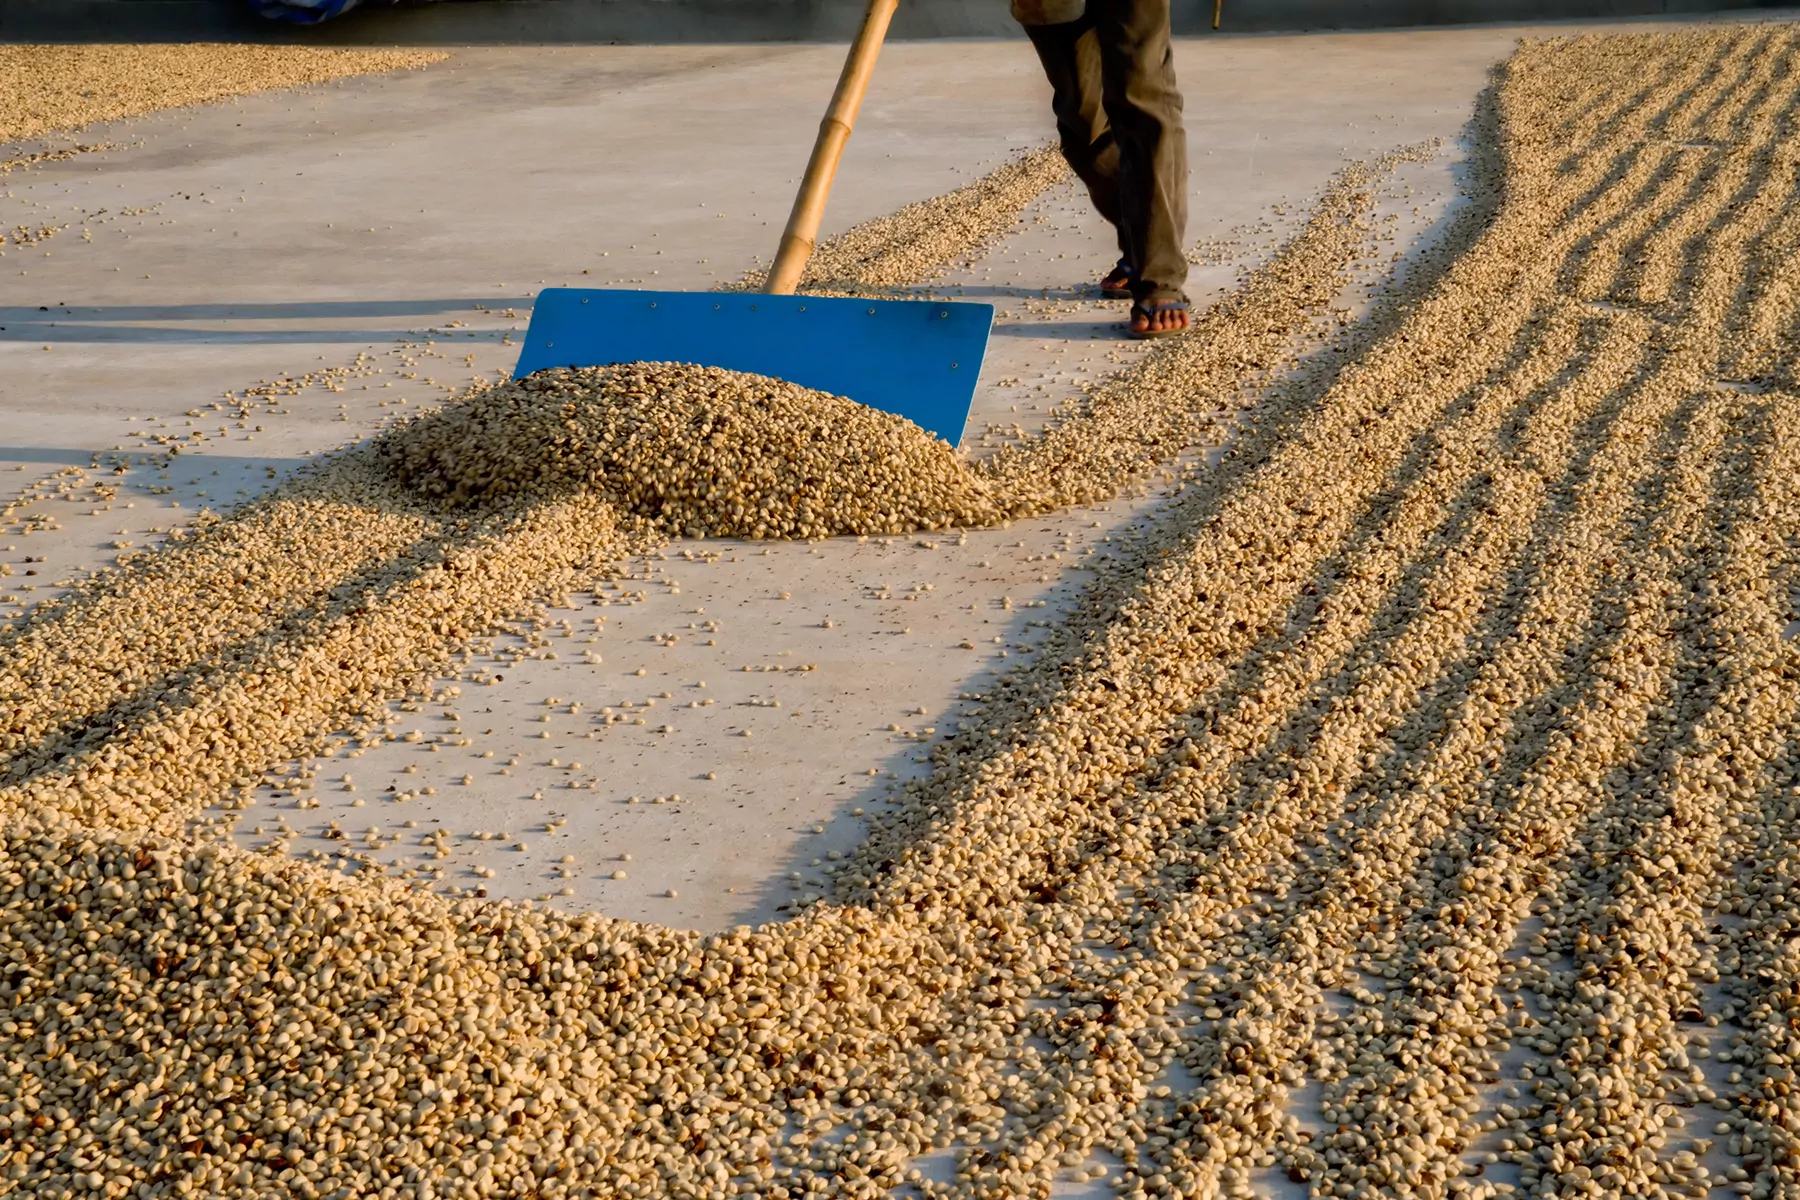
Coffee processing is a key cause of green’s carbon footprint
Washed and anaerobic process methods are also significant contributors to green coffee’s carbon footprint. Across the farms in the Central American study, 57% of emissions were caused by fermentation and waste water. Natural processing, which is more common in other coffee-producing regions, has a lower carbon footprint.
Because coffee processing is a key cause of greenhouse gas emissions, the industry should anticipate that it will become a point of focus. The increasing popularity of washed and fermented coffees stands in tension with the industry’s objective to lower its emissions. Innovations in coffee processing need to be paired with technological innovations to reduce, or capture, greenhouse gases.
Calculating the carbon stock on coffee farms
As well as measuring the greenhouse gas emissions from coffee production, it is also necessary to calculate a farm’s carbon stock. The value of the stored carbon is apparent when considering clearing vegetation to increase coffee production.
When land is cleared, greenhouse gases are released into the atmosphere and the farm’s carbon sequestration capacity is reduced. Even if the farm utilises best practice for low carbon coffee production, its total carbon emissions increase.
Clearing forest for coffee production is a vicious cycle, but often an economic necessity for farmers. As the climate warms, the ideal conditions for coffee production are shifting to higher elevations where the temperature is cooler. Also, to increase production output and revenue, farmers plant more shrubs. In both cases, this new land often comes available as a result of deforestation, further contributing to climate change. It’s an occurrence where environmental and development objectives stand in direct conflict.
As well as being a key cause of coffee’s carbon footprint, deforestation is another factor why farm level calculations vary; it is included in some studies and not others.
Emerging best practice is to evaluate the carbon stock of a farm and the carbon emissions from coffee production separately. Together they provide a more accurate measure of the total greenhouse gas emissions of a year’s harvest as well as tracking how a farm’s emissions change over time. And measuring helps assess the impacts of either clearing land for production or putting degraded land back into coffee production or forest.
Another key store of carbon on a coffee farm is soil. The carbon stock in the soil of polyculture farm systems is greater than monoculture farm systems. Plus, polycultural systems reduce soil erosion, a further cause of greenhouse gas emissions.
Get insights like this in your inbox
A new generation of models is required
For coffee businesses to accurately calculate the carbon footprint of green coffee, the industry needs new models.
None of the calculators currently estimate changes of carbon stock in both vegetation and soil. This limitation massively reduces the ability of industry to accurately estimate green coffee’s carbon footprint.
These limitations also curb the usefulness of a number of academic studies. Some include carbon sequestration by forest and the associated carbon stocks; many do not. And only a very few studies include an analysis of soil carbon stock.
At present, no carbon model accurately calculates green coffee’s carbon footprint.
The new generation of models should calculate greenhouse gas emissions from farming and processing, include the quantity of carbon sequestered across the farm, and identify annual changes to the farm’s carbon stock in both vegetation and soil.
It is likely to take several years further scientific work before the coffee industry will be able to accurate calculate farm emissions.
At present, no carbon model accurately calculates green coffee’s carbon footprint.
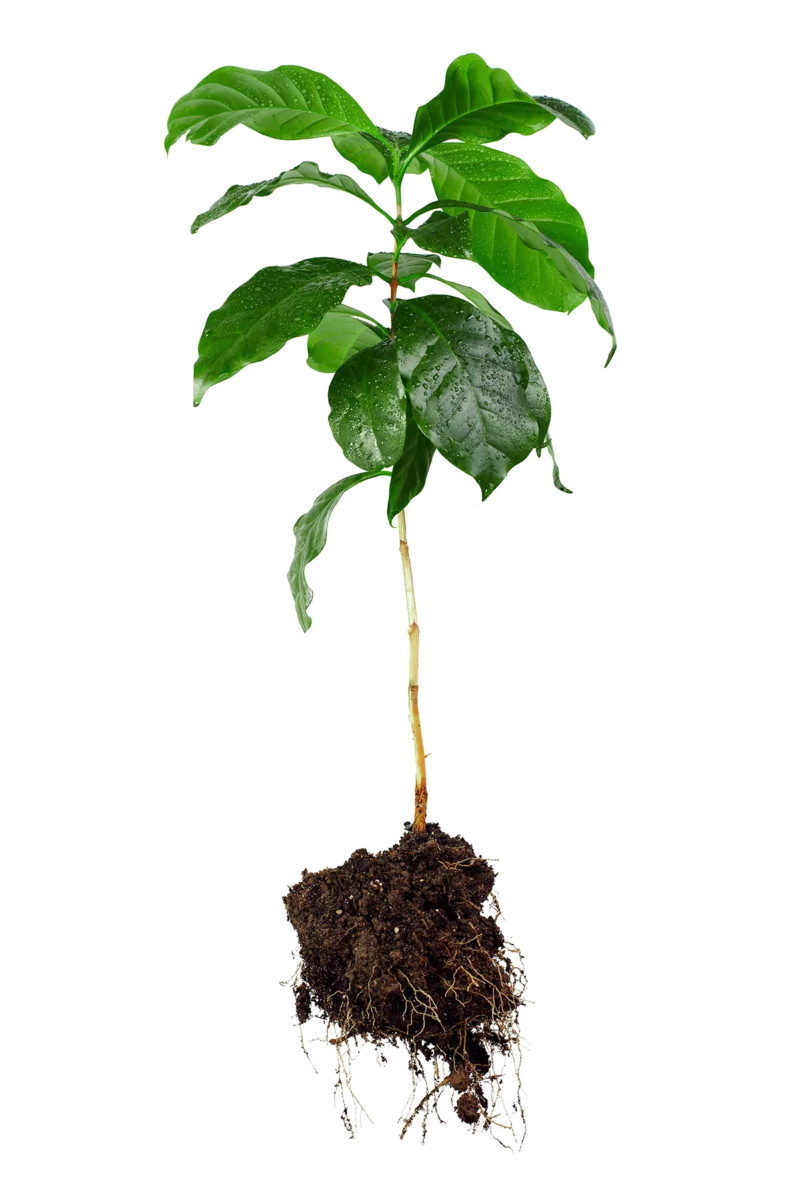
Carbon sequestration in coffee shrubs
Further complicating the methodology is the international standard for calculating green coffee’s carbon footprint, which intentionally excludes carbon sequestered and stored in coffee shrubs.
Coffee shrubs have a productive life of several decades. The received wisdom is that shrubs start to bear fruit at three years and have a productive lifespan of between 10 and 30 years. However, through heavy fertiliser application, some farmers harvest cherries less than a year after planting. And shrubs can be long-lived, some are productive for as long as 80 years.
The current standard doesn’t permit carbon sequestered by coffee shrubs themselves to be offset against production emissions. This is in part because the methodology was originally developed for crops that are sown each year, such as grains; the difference is that coffee shrubs produce cherries over decades. There is also an appreciation that coffee shrubs are regularly pruned to enhance yield. Some of the sequestered carbon is released back into the atmosphere when clippings are burnt or left to decompose.
As well as developing new models for calculating green coffee’s carbon footprint, the industry needs to consider challenging the international standard. Given the typical working life of coffee shrubs there is a good argument that the sequestered carbon should be deducted from production emissions.
Improving accuracy
Updates to the carbon models and international standard will reduce our current estimates of green coffee’s carbon footprint.
Although changes to the calculators won’t reduce coffee’s actual carbon footprint, a more accurate calculation will shine a brighter light on the already-identified, key emissions. Namely, fertiliser use, emissions during processing, the electricity consumption of espresso machines and the carbon footprint of milk.
There is a good argument that the sequestered carbon should be deducted from production emissions.

Working with what we know
Specialty coffee businesses seeking to calculate their total carbon footprint face a dilemma.
For example, it’s not possible to calculate the carbon footprint of say Climpson & Son’s recent Broadway Blend. It was comprised of 50% COMSA, Honduras as well as Padah-Lin, Myanmar. An estimate would rely on generic Honduran farm data and it’s anyone’s guess what the carbon footprint of a Burmese coffee might be.
Similarly, what input figures should be used for Origin’s Resolute espresso blend? It currently mixes a washed coffee grown at altitude in Peru, a machine harvested natural from Brazil and washed Yirgacheffe from Ethiopia.
It’s important to note, uncertainty extends across all of specialty coffee, for all origins, and almost all farms. And of course, apart from a handful of farms which have benefited from detailed scientific analysis, there’s uncertainty across commodity coffee too.
In these circumstances, the prudent action is to wait for the science to further develop while we focus our efforts on cutting the greenhouse gases that we generate.
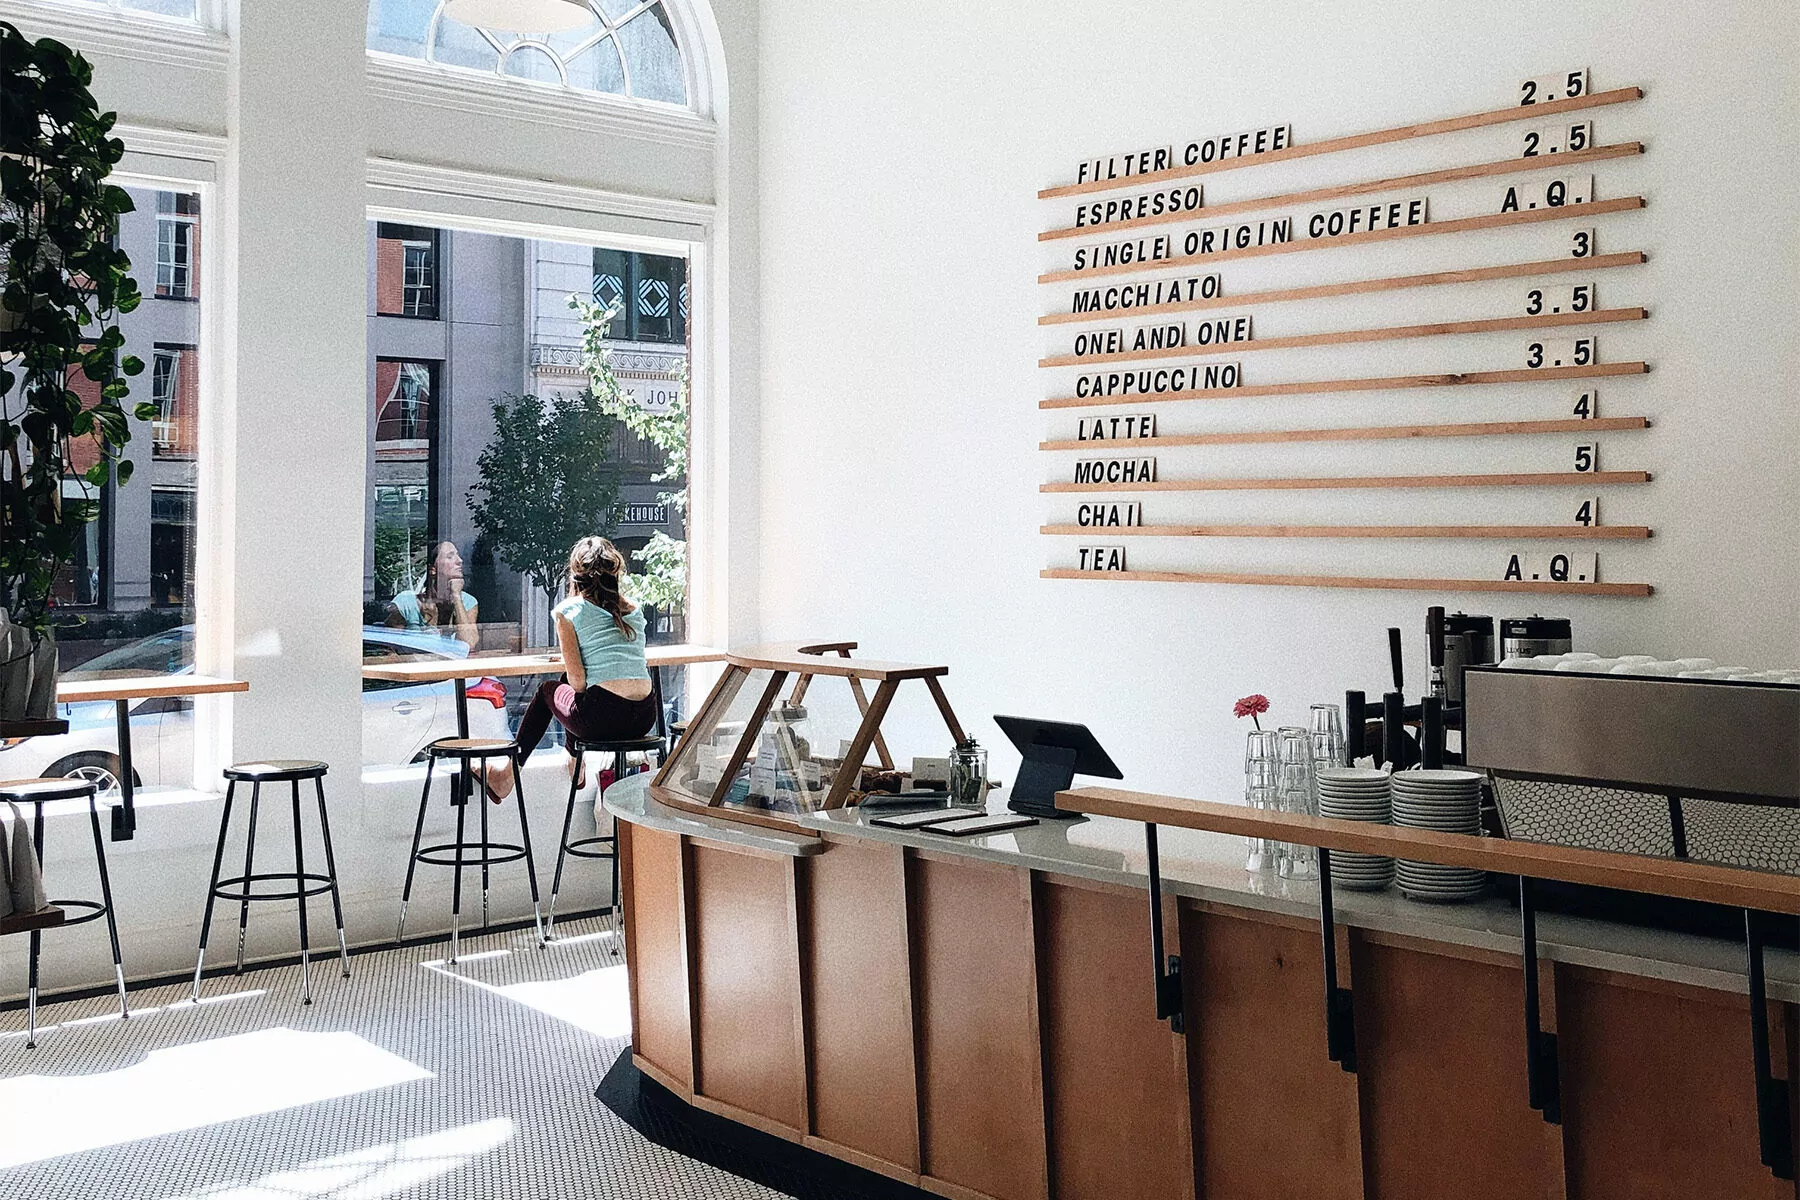
United Baristas started our analysis of coffee’s carbon footprint using a cup of coffee, in part because green coffee is a small component of the total. A flat white’s carbon emissions are largely from milk and the electricity consumed by the espresso machine. The total carbon footprint of most milk-based serves isn’t significantly impacted whether the green coffee has low, or high, greenhouse gas emissions. Also, there is currently greater opportunity to cut a flat white’s carbon footprint by trimming emissions during the consumption phase, rather than at origin.
The same is true for the carbon footprint of coffee shops. The majority of emissions come from activities and products that have reasonably certain footprints, such as milk, electricity and baked goods. In other words, we can have confidence in the estimates because the inputs with greatest uncertainty comprise a small portion of the total.
By contrast, it’s tricky to accurately estimate the carbon footprint of products such as black coffee or pods, and for businesses such as roasters or green importers. In these cases, a large portion of the total footprint is from green coffee. Consequently, any estimate is likely to be inaccurate.
We don’t have accurate data for the overwhelming majority of green coffee.
A little information can be a dangerous thing
It is imprudent to take specific research and apply it to your business or products, especially when the farm system or process methods deviate from typical specialty coffee practices.
For example, a 2021 study comparing the footprint of various brewing methods analysed green coffee dried by wood fire. The study’s conclusions have been used by some roasters to provide advice to their customers. The carbon credibility of these roasters has gone up in smoke.
Another recent paper raised tensions between V60 and Aeropress drinkers to boiling point when it was sensationally written up by an American coffee blog. The website neglected to mention, or maybe they didn’t know, that the data was from a 15 year old study of predominately monocultural farms in Brazil. Obviously, the paper neither reflects the latest science nor filter fans’ coffee preferences. And, the brouhaha did nothing to cut emissions.

A figure often referenced by coffee businesses starting to calculate their carbon footprint – presumably because it ranks highly in Google searches – assumes that air transport of bulk green shipments to the United Kingdom is commonplace. Without irony (or maybe coffee supply chain research), the authors recommend green should be transported by sea to make it more sustainable. For our money, the industry’s sourcing and sales trips, which are not included in any of the studies mentioned here, are likely to be a greater contributor to global warming than air-shipped samples.
It’s not that any of these studies are wrong, it’s that they are only correct in a very specific context. And extrapolating their findings risks error. When coffee businesses do this, the results conjure up an alternate reality. At best, this delays our action on climate change because we incorrectly conclude action needs to be taken elsewhere. And at worst, it further – and inappropriately – burdens coffee producers.
If coffee businesses insist on calculating their green carbon footprint, it’s better to use a range to test how significant its contribution is towards your total emissions. Start with a very low figure of say 1 Kg per kilogram of green and then test the impact if the footprint were to be 10 Kg per kilogram. The greater green coffee is as a proportion of your total emissions, the more cautious you should be about the accuracy of your estimates.
If you absolutely must estimate your green carbon footprint, start with a very low figure of say 1 Kg per kilogram of green and then test the impact if the footprint were to be 10 Kg per kilogram.
Taking action now
The green input figure is a moot point for coffee businesses wanting to cut their carbon footprint. There is already an abundance of good data from multiple studies showing that electricity consumption during coffee making and milk are the key causes of a flat white’s carbon footprint, the most popular coffee serve in the United Kingdom and much of Europe.
Plus, multiple academic and industry studies make it clear that coffee grown with organic fertiliser, with minimal fertiliser application, in a polycultural farm system typically has lower carbon emissions. And, these types of farms generally have higher carbon stocks.
Finally, further consideration can be given to processing method. Natural process coffee have a lower carbon footprint than washed or fermented coffee.
Future academic and industry research will help the coffee community accurately calculate the carbon footprint of specific green coffees, but there’s plenty of things we can do already to cut emissions.
Focus on the things we can control
Let’s work now on the emissions that are under our direct control and then progress to working with our coffee producing partners to assist lowering their emissions. It’s unfair, hypocritical, and an extension of the carbon inequality that’s already at the heart of climate change to ask coffee producers to cut their emissions based on dubious calculations before we’ve made substantial reductions of our own.
To better tackle emissions, coffee businesses can narrow the scope of their analysis for the time being. Until there’s higher quality data available for green coffee, it’s legitimate for coffee businesses, especially roasters and importers, to calculate the carbon footprint of just their own operations.
This approach provides an accurate benchmark and clear information on how to reduce carbon intensity. Plus, focusing on in-house emissions leads to better-informed, everyday decisions such as flights to origin, switching to an electric roaster or cutting the emissions generated by in-country logistics and transport.
The science is clear. By taking responsibility and cutting our carbon footprints now, we will generously give coffee producers more time and resource to cut theirs.
It’s unfair to ask coffee producers to cut their emissions based on dubious calculations before we’ve made substantial reductions of our own.
Tackling climate change
What action is your coffee business taking? What other ways can you significantly reduce your carbon footprint? Let us know, we’re on all the usual channels.
Take action
Learn how United Baristas is working to reduce the coffee industry’s carbon footprint, from crop to cup. And discover the meaningful things you can do.
Select references and further reading
- Life cycle analysis and the carbon footprint of coffee value chains, Louis Bockel and Laure-Sophie Schiettecatte, Food and Agriculture Organization of the United Nations
- Environmental Profile of Brazilian Green Coffee, Leda Coltro, Anna Lúcia Mourad, Paula A.P.L.V. Oliveira, José Paulo O.A. Baddini and Rojane M. Kletecke in The International Journal of Life Cycle Assessment, 2006
- Carbon footprints and carbon stocks reveal climate-friendly coffee production, Henk Rikxoort, Götz Schroth, Peter Läderach, Beatriz Rodríguez-Sánchez in Agronomy for Sustainable Development, 2014
- Carbon Accounting for Coffee-Based Farming Systems, Umesh Acharya and Rattan Lal, The Ohio State University, 2021
- Carbon footprint across the coffee supply chain: the case of Costa Rican coffee, Killian, B., L. Rivera, M. Soto, and D. Navichoc. in Journal of Agricultural Science and Technology, 2013
- Biodiversity Conservation in Traditional Coffee Systems of Mexico, Patricia Moguel & Víctor Toledo in Conservation Biology, 1999
- Greenhouse gases: Carbon footprint of products: Requirements and guidelines for quantification, International Organization for Standardization
